Ethereum Emissions
Ethereum emits around 20 ktCO2/day, similar to 2–3 coal power plants. Estimated from hashrate, GPU efficiency, miner location, and more.
This summary assumes some familiarity with Ethereum. The full article explains in more detail and the tracker shows realtime stats.
The crypto art boom of early 2021 saw the digital arts scene come apart at the seams, triggered by the question: is proof-of-work bad for the environment? Factions emerged quickly: “yes, PoW is a massive polluter”, “no, PoW runs on hydropower and has lower emissions than physical goods”, and “the real issue is crypto-anarcho-capitalist deregulation designed to extract and exploit, rewarding the rich and further entrenching art as a financial asset.”
It was fiendishly difficult to have a good-faith discussion about the environmental question, because the only up-to-date estimate of Ethereum’s energy use and emissions came from Alex de Vries (Digiconomist). His hotly contested work assumes that a fixed portion of mining revenue is spent on expenses like electricity and hardware. Working backwards from the revenue that miners make from mining, he estimates what they must be spending on electricity, and how much electricity they are using. He explains the process for Bitcoin, and applies the same principles to his Ethereum analysis.
After reading a paper by Jonathan Koomey that encourages taking a bottom-up approach to energy estimates instead of Alex’s top-down approach, I looked for some bottom-up estimates. When I couldn’t find one I was happy with, I did some research and built a new Ethereum emissions tracker.
This is the part where I am supposed to say “what I found will shock you”, but perhaps what is most surprising is that the previous attempts at answering this question seem to have been basically correct in their conclusions.
The first step for a bottom-up energy estimate is to establish which variables are in play. The most important factors are:
- Hashrate. We can get this from Etherscan.
- Hardware overhead (CPU, network card, fans)
- Datacenter overhead (fans, lighting, networking infrastructure)
- Grid loss. A significant portion of the electricity generated does not make it to the consumer (typically around 6%).
- Hashing efficiency. How fast does the hardware hash at a given power?
- Power supply efficiency. Most power supplies are only 80-90% efficient, losing a bunch of electricity as heat.
We can make good estimates for most of these, but the real tricky ones are hardware overhead and hashing efficiency. Hardware overhead is massively variable, because some people run a single GPU in their closet (high overhead) while big farms run 8 GPUs on one single-purpose worker (low overhead), or Innosilicon miners that have the extra hardware built in (zero overhead).
Hashing efficiency is variable because every GPU is different. An Nvidia A100 is very expensive but will mine at 170 megahashes per second (MH/s) while using 200 Watts of power, a searing 0.85 MH/s per Watt. And a Nvidia 2060 is more likely to perform around 31 MH/s while using 128 W, a much lower 0.24 MH/s per Watt.

How do we figure out which GPUs people are actually using?
- We can look at HiveOS, which tracks some live statistics.
- We can check worker IDs on Nanopool where miners often name their workers based on the hardware they are using.
- We can assume that benchmark sites primarily benchmark hardware that is popular for mining, and that miners have followed the generally increasing trend in efficiency.
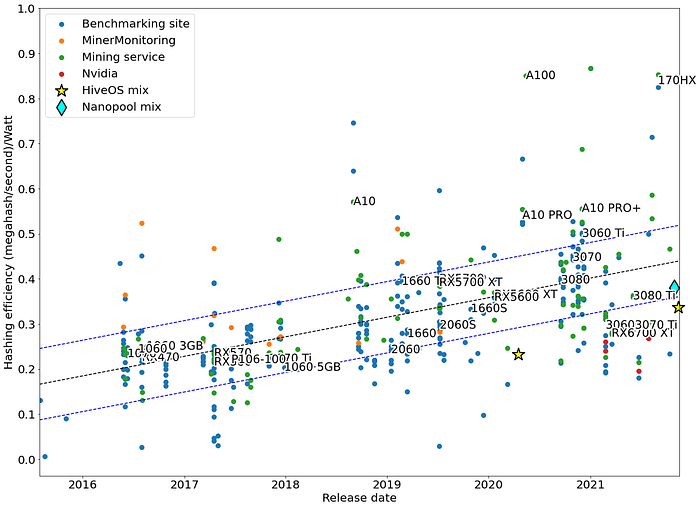
My trendline may be slightly conservative here, as it seems to follow a higher efficiency than what we get looking at Nanopool or HiveOS. But it may not be completely unrealistic, given the lack of representation of custom GPU miners on HiveOS and Nanopool (like the Innosilicon ones above).
To estimate the hardware overhead, we can look at the hashrate of Nanopool workers. If we count up all the workers grouped by their hashrate, we find that there are a bunch of low-hashrate workers. This is because Ethereum, unlike Bitcoin, is heavily mined by home GPUs. However, if we count up the hashrate itself, we find that the majority of the hashrate is provided by high-hashrate workers.
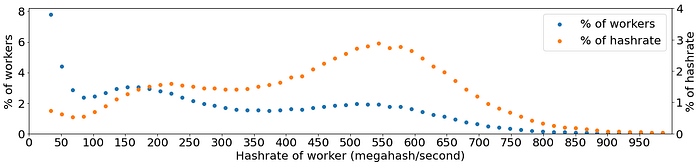
Because most GPUs only hash in the 100MH/s range, this tells us that a big chunk of the machines mining Ethereum are multi-GPU, creating a relatively low average overhead. Which is fortunate, because small-scale home mining is the worst scenario from an energy perspective.
Once we have all our parameters, we can multiply: daily hashrate, hardware overhead, datacenter overhead, and grid loss. Then divide: hashing efficiency, and power supply efficiency. This gives us a daily power estimate in gigawatts.
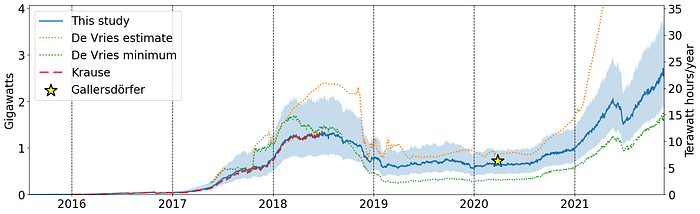
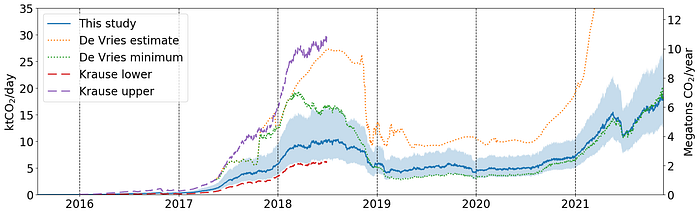
Some other sources like Alex use an annualized Terawatt hours per year (“how much energy would the network use if we ran it at today’s power for a whole year?”) so let’s put that scale off to the right side. There are some other studies like Krause and Tolaymat and Gallersdörfer which basically agree with my results here. Alex is a bit of an outlier, but we find ourselves somewhere between his lower bound and his best guess. His estimate has ballooned in this last year because the price of Ethereum has ballooned along with the hashrate. This could mean that a lot more small-scale miners are getting in on the action, or it could mean that miners are turning on more older and less efficient hardware (though it’s not clear they have any more hardware to turn on), or it could simply mean that miners are making more profit recently and this is getting mixed up with the energy estimate.
To estimate the emissions of the Ethereum network, we need to know where the mining is happening. Different regions all provide different kinds of electricity, with different mixes of fossil fuels, renewables, and nuclear. There is no direct way to figure out where miners are located. There have been some studies about Ethereum nodes (Kim, Anderson, Etherscan) but the vast majority miners are not nodes—they are just mining as part of a pool. So we need to look at the blockchain itself.
In each new block, there is a small space for leaving a message, called “extraData”. Early in Ethereum’s history this was used to share inside jokes and leave notes for posterity:
Today it’s used by many miners to make a note of which server submitted the block. For example, Ethermine might write “us-east-2” to indicate it was submitted by a server in the East US, probably from a miner who picked that server because it was near by.
If a block doesn’t have extraData, we can also make a guess about where it was mined based on the pool that mined it. Each pool serves a geographically distributed set of users that changes over time, but we have one good snapshot from 2018 provided by Paulo Silva et al. For the other pools we can make a guess based on community history, Reddit posts, server locations, langauge/localization options, and other hints.
When we combine all this data we get a picture of where mining has been located over time:

We can break these regions down in a more detailed way, down to specific electric grids, based on knowledge from other sources: news coverage of miner activity, information about Bitcoin miner locations (which should generally mirror Ethereum mining locations), and other hints. Each electric grid has its own emissions factor.
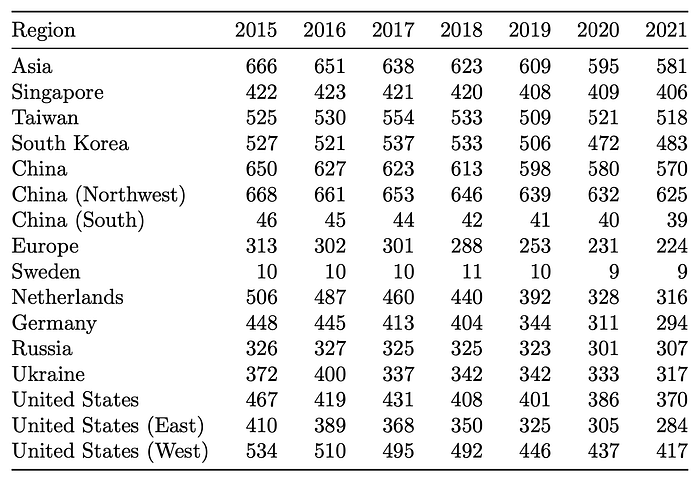
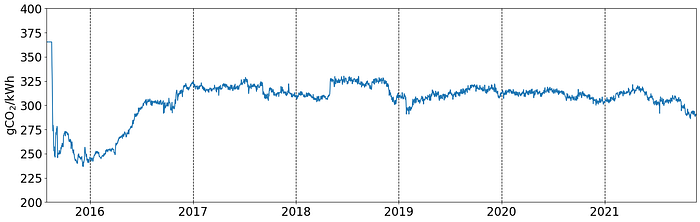
A higher number means that more CO2 gets emitted for the same amount of energy used. One very important thing to note is that mining in China has historically moved back and forth between South China, with cheap and abundant hydropower in the wet season, to Northwest China, with a higher proportion of fossil fuels but cheaper power in the dry season. The balance is roughly a 50–50 mix throughout the year. Once we take a weighted average of all the grid locations based on everything we learned from the block metadata, and multiply by the total energy, we get an emissions total for each day:
Again we can see that we’re roughly in agreement with other studies, but Alex de Vries is using a higher electricity estimate, and also a higher emissions factor. While Alex uses an emissions factor of 475gCO2/kWh (the global average), my emissions factor hovers around 320gCO2/kWh:
Two really important things are missing here:
- If the intra-year changes were fully accounted for, we would see a yearly “wobble” in the emissions factor as miners move between provinces in China. I haven’t been able to find that data in the blockchain yet. To the extent that this “wobble” lines up with price bubbles, it could make some bubbles worse than others. Right now the wobble is just “flattened out” across the whole year.
- With the 2021–05–21 Chinese mining ban, the amount of mining in China has nosedived. This should theoretically send the emissions factor higher, as many Chinese miners are moving to areas with more fossil fuels like Kazakhstan and Texas. That isn’t reflected in this analysis because I treat the “Asia” mining as automatically including some “China” mining. A better model would account for how the mixture of mining in “Asia” has changed over time.
So what does this all mean? If these numbers are right, Ethereum is using around 2.6 gigawatts (GW) right now, which would annually come to around 23 terawatt hours per year (TWh/year). This could be made to sound large, by comparing it to an entire country like Ecuador (26 TWh/year) or a US state like Massachusetts (21 TWh/year). Or it could be made to sound small, because it’s only 0.1% of global electricity—people in the USA use three times as much electricity each year just watching television. What’s the most appropriate comparison to make? There’s nothing quite like this “world computer slash cryptocurrency” in our everyday life. Our most familiar references in the digital world are centralized products like Facebook, which serves billions of people on 7.2TWh/year. Ethereum, by comparison, can only handle around 15 transactions per second.
In terms of emissions, we could compare the 20 ktCO2/day, annualized to 7 MtCO2/year, to an entire small country like Costa Rica (9 MtCO2/year). Or we could compare it to the yearly emissions of 500 thousand people in the USA, or 4.2 million people in India. A typical coal power plant emits around 3 MtCO2 per year. For every day that proof-of-stake is delayed, Ethereum is effectively operating a two to three coal power plants.
We can’t change the past, but we can switch away from PoW. And it’s not too late to put some of the massive profits from the crypto space into addressing the impact.